
Quality art education nurtures creative abilities and builds confidence, cultural awareness, and adaptability. Students need strong K-12 art programs, access to higher education opportunities in creative fields, and clear pathways to meaningful careers in the arts.
Recognizing this need, we recently launched Vecteezy for Education, a specialized program designed to give teachers and students unlimited access to professional-grade visual assets. This initiative provides educators and students with a carefully curated library of over 60 million (and growing) images, videos, and graphics that are safe and appropriate for classroom use.
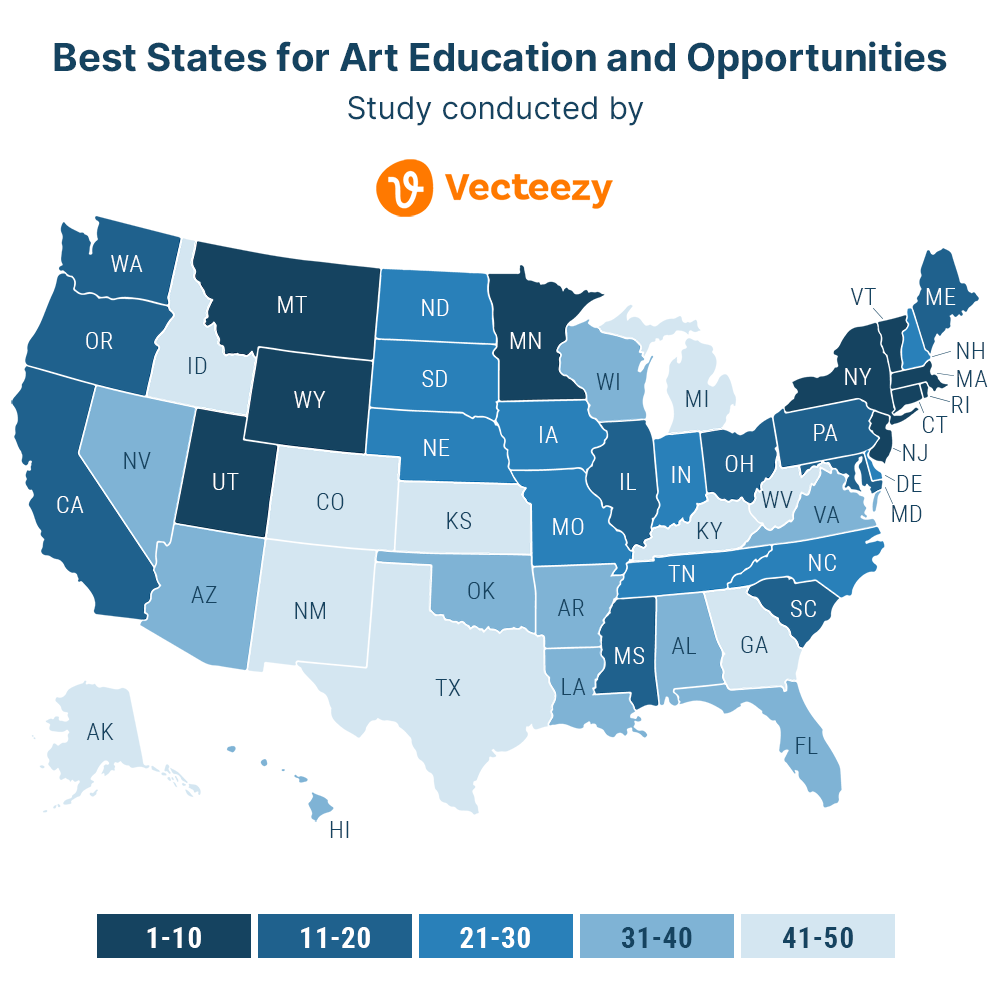
To better understand the current state of art education, we conducted a comprehensive study analyzing art education and opportunities across the United States. We analyzed data from multiple sources, including the National Assembly of State Arts Agencies (NASAA), Arts Education Partnership (AEP), National Center for Education Statistics (NCES), National Association of Schools of Art and Design (NASAD), and the Bureau of Labor Statistics (BLS).
The rankings are based on:
- State Arts Funding: Per capita spending on state arts agencies
- K-12 Requirements: Art education mandates for elementary, middle, and high school students
- Accredited Institutions: Number of schools recognized by the National Association of Schools of Art and Design (per capita)
- Degree Programs: Availability of visual arts degree programs at colleges and universities (per capita)
- Career Opportunities: Employment rates in visual arts professions per 1,000 workers
See the end of the article for complete methodology and data sources.
Top 10 States for Art Education and Opportunities
The full rankings of all 50 states can be found below, but first, let’s highlight the top ten and why they’re leading the pack.
1. Vermont
Vermont scored the maximum possible points for K-12 art education requirements, with stated policies for elementary, middle, and high schools students, plus an assessment policy. And with a population of less than 700,000, Vermont also led all states in postsecondary degree programs in visual and performing arts (per capita), thanks to a wide range of options at Bennington College, Vermont College of Fine Arts, Vermont State University, University of Vermont, Middlebury College, and others.
2. Rhode Island
Rhode Island earned the maximum score for art education and assessment policies and scored relatively well in all the other ranking factors. Only five states scored higher in the number of visual arts jobs per 1,000 workers, and only Vermont edged Rhode Island in per capita postsecondary degree programs in visual and performing arts.
3. New York
New York ranked #1 for the most visual arts jobs per 1,000 employees (21.5) and #6 for arts spending per capita.
4. Massachusetts
Massachusetts earned the maximum score for arts education and assessment policies, and ranked #3 for per capita postsecondary degree programs in visual and performing arts.
5. Wyoming
The first state outside of the northeast in our rankings, Wyoming led all states in accredited (by NASAD) institutions per capita and ranked #3 in postsecondary degree programs in visual and performing arts per capita. But only two states (West Virginia and Mississippi) ranked lower for visual arts jobs per 1,000 workers.
6. Minnesota
Only Hawaii had higher per capita spending on arts than Minnesota, and only eight states scored higher for arts education and assessment policies.
7. Montana
Montana earned the maximum score for arts education and assessment policies, and ranked #5 for visual arts jobs per 1,000 workers.
8. New Jersey
New Jersey ranked #7 in per capita spending on arts and earned the maximum score for arts education and assessment policies.
9. Utah
Utah scored relatively well across the board, without any major standouts (#7 in visual arts jobs per 1,000 workers, tied for #9 in arts education as assessment policies, and #10 in per capita arts spending).
10. Connecticut
Connected ranked #5 in per capita postsecondary degree programs in visual and performing arts, tied for #9 in arts education and assessment policies, and ranked #10 in per capita arts spending.
Full Rankings
- Vermont
- Rhode Island
- New York
- Massachusetts
- Wyoming
- Minnesota
- Montana
- New Jersey
- Utah
- Connecticut
- California
- Ohio
- Maryland
- Pennsylvania
- Mississippi
- Illinois
- Washington
- Oregon
- South Carolina
- Maine
- Nebraska
- Iowa
- South Dakota
- Missouri
- Delaware
- Tennessee
- Indiana
- North Dakota
- New Hampshire
- North Carolina
- Hawaii
- Virginia
- Arkansas
- Florida
- Louisiana
- Nevada
- Oklahoma
- Wisconsin
- Alabama
- Arizona
- Kentucky
- Texas
- Idaho
- New Mexico
- Kansas
- Colorado
- West Virginia
- Michigan
- Alaska
- Georgia
Observations
- Northeastern states dominated the rankings. The New England States, in particular, scored very well in postsecondary degree programs. Most northeast states also scored well for arts education and assessment policies.
- Several states with large populations struggled in the rankings. California (ranked #11 overall despite being #2 in visual arts jobs per 1,000 workers) includes more NASAD accredited institutions and offers more postsecondary degree programs in visual and performing arts than any other state, but the per capita numbers rank much lower. Texas (#42 overall) and Florida (#34 overall) also struggled in the per capita ranking categories.
- Only 3 of the 10 lowest ranked states scored above average in arts education and assessment policies.
- Six of the bottom 10 overall ranked states were in the bottom 10 in arts spending per capita. Five of the top 10 overall also ranked in the top 10 in arts spending per capita. Montana was the lowest spender (ranked #30 in per capita arts spending) to finish in the top 10 overall.
About the Study
The comprehensive analysis examined publicly available data, creating a weighted formula that accounts for population differences and provides a fair comparison of arts education opportunities nationwide.
Methodology
To determine which states offer the best combination of arts education and career opportunities, we evaluated multiple data points from reputable sources.
1. Data Sources
We collected the most recent available data from the following sources:
- National Association of Schools of Art & Design (NASAD) for the number of accredited institutions in each state, and then calculated the number per capita.
- National Center for Education Statistics (NCES) to compile a list of degree programs in each state. We counted all degree programs with CIP codes 50.01 to 50.99, which includes all visual and performing arts programs. Each program was counted individually. For example, if one college offers 10 degree programs that fall into this range and another college offers 4, this would total 14 degree programs. The total visual and performing arts degree programs in the state were added and calculated per capita.
- U.S. Bureau of Labor Statistics (BLS) for employment figures. We collected employment data from Occupational Employment and Wage Statistics report . We checked each state to gather the number of employees in SOC code 27-0000 (Arts, Design, Entertainment, Sports, and Media Occupations).
- National Assembly of State Arts Agencies (NASAA) for per capita state spending on the arts. We used the Legislative Appropriation Including Line Items from page 17 of the NASAA: State Arts Agencies Revenue Report (2025).
- Arts Education Partnership for art education requirements and assessment policies. We checked each state’s policies via the ArtScan State Profiles. Each state could earn up to 4 points in total. They earned 1 point each for having set policies on art education requirements for elementary, middle, and high school students. They could also earn a point for having an established policy for arts education assessments.
- United States Census Bureau for state populations (numbers from the 2024 census were used for the per capita calculations).
2. Categories and Metrics
Each state was scored in five key categories:
- Normalized Per Capita Arts Spending
- Normalized Accredited Institutions Per Capita
- Normalized Degree Programs Per Capita
- Normalized Employment in SOC Code 27-0000
- Normalized Arts Education and Assessment Requirement Points
3. Normalization
Each metric was normalized, scaling each category to a range between 0 and 1, where 1 represents the highest value among all states and 0 represents the lowest.
4. Logarithmic Transformation of Arts Spending
Per capita arts spending varied dramatically between states, with a few states spending far more than the rest. To prevent these extreme values from disproportionately influencing the rankings, we applied a natural logarithm transformation to the spending data before normalization. This compresses very large values and expands very small ones, reducing skew and making comparisons between states more balanced and meaningful.
5. Scoring and Ranking
The Total Score for each state was calculated as the sum of its normalized values in all five categories. Each category carried the same weight. States were then ranked from highest to lowest based on their total scores.
6. Treatment of Washington, DC
Washington, DC, was initially included in the dataset, but we felt the results were skewed because DC is completely urban. The numbers in some categories, like per capita spending and jobs data, were drastically different than the 50 states. As a result, we felt the rankings were more appropriate with DC excluded.
Photo by Myron Standret